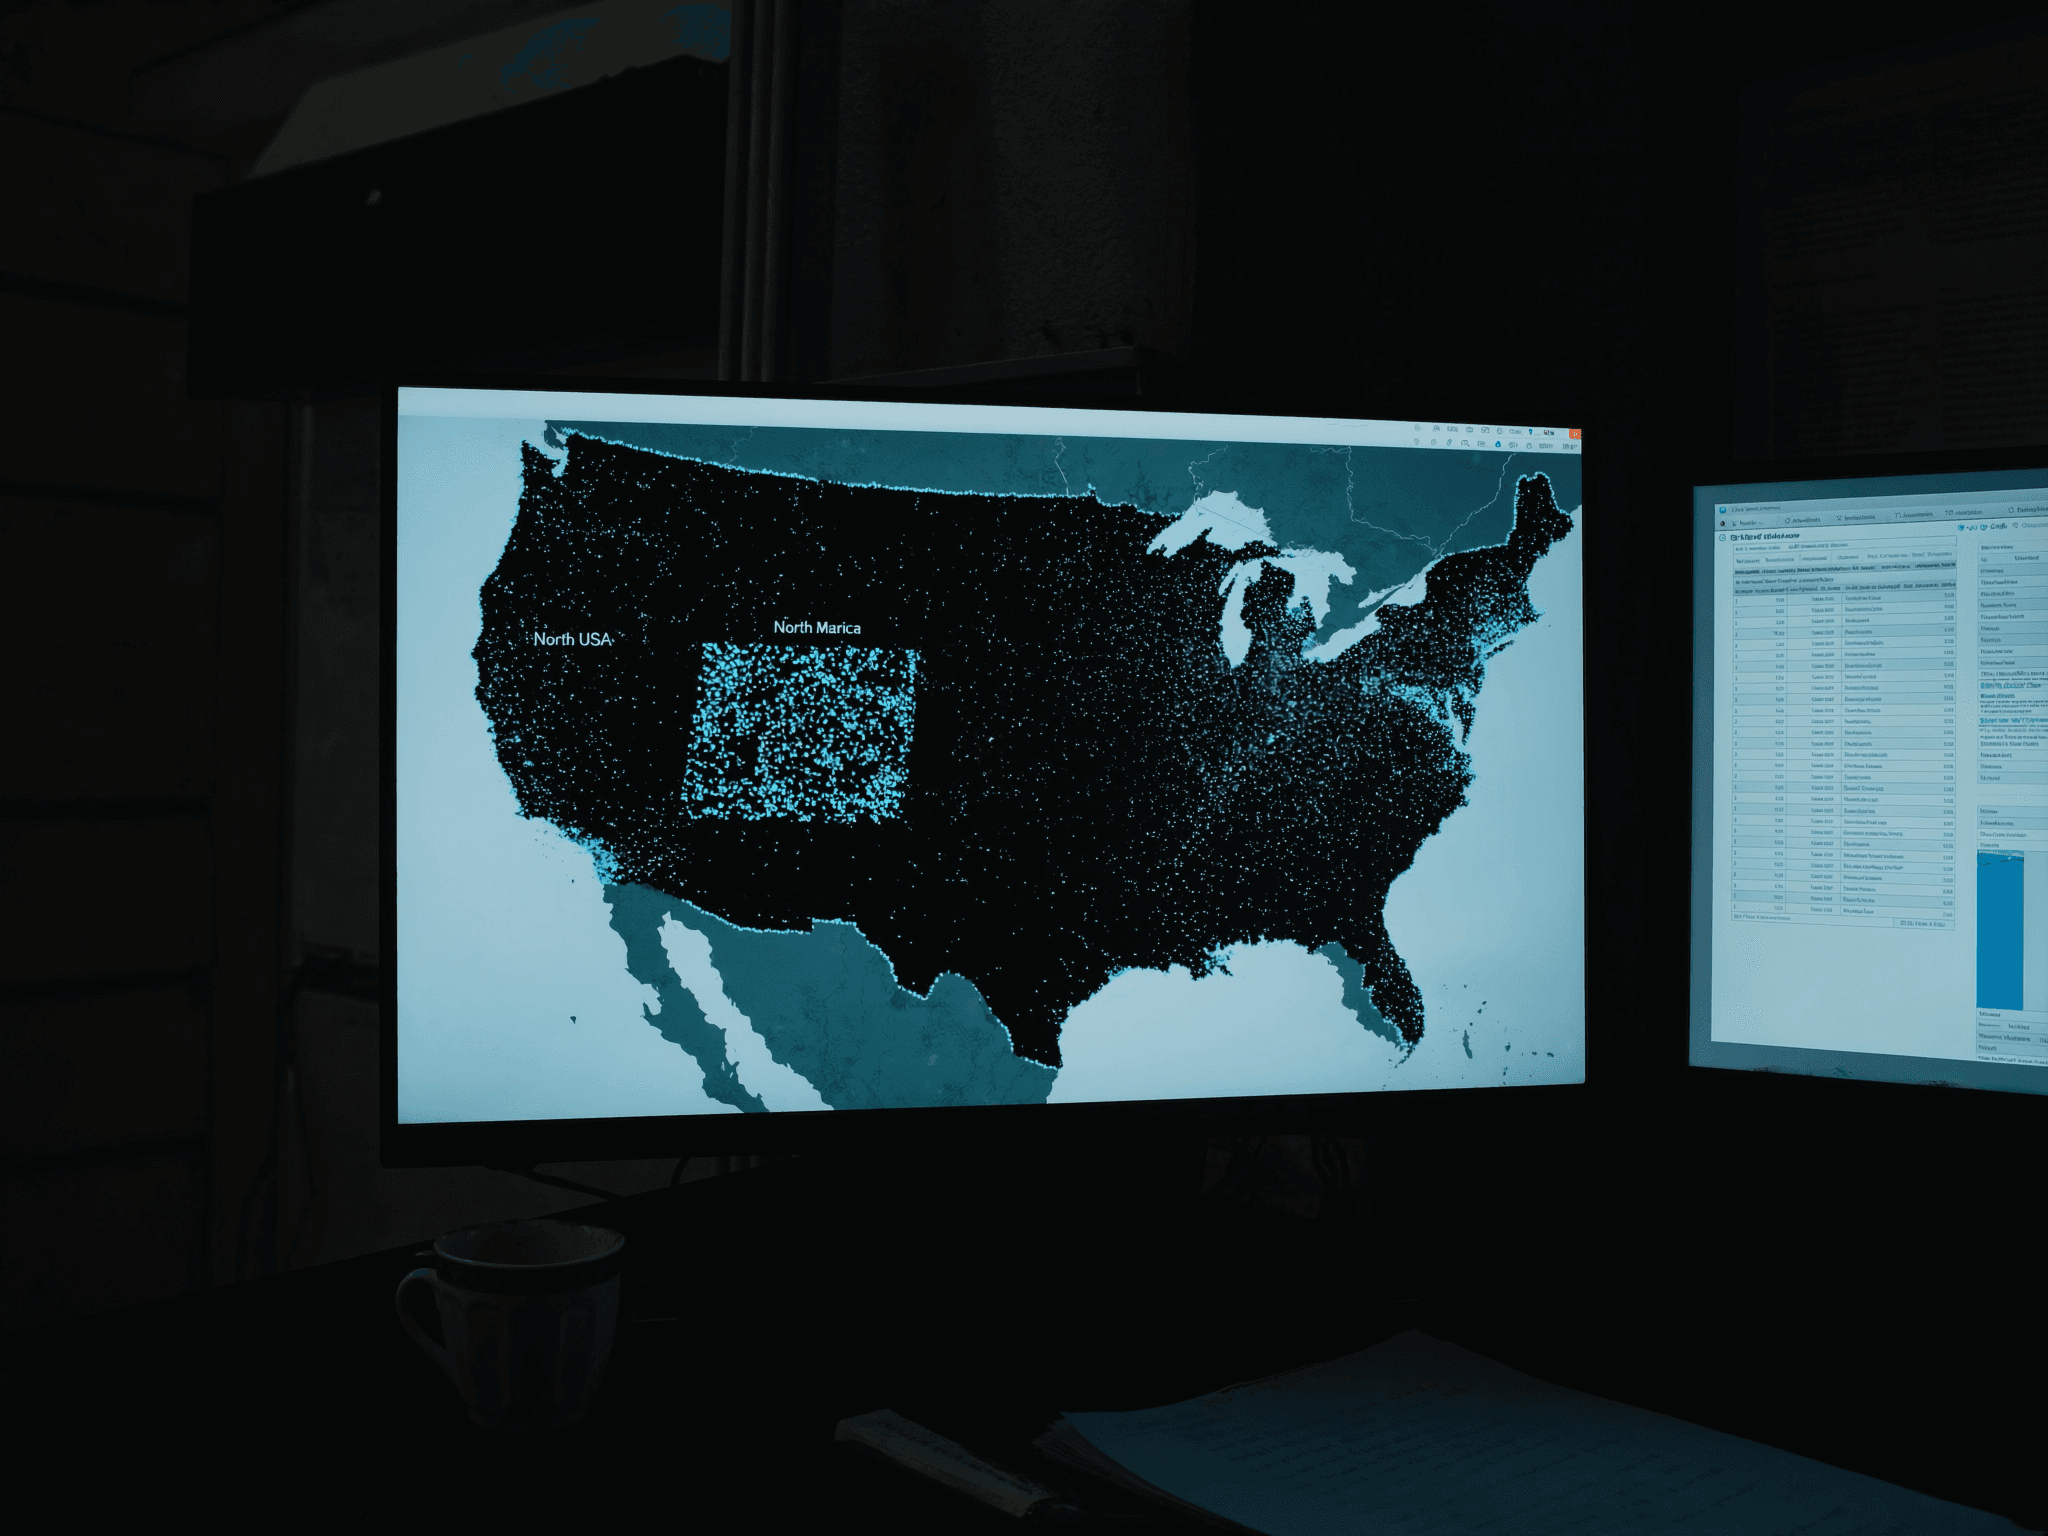
The Sighted map looks like a constellation: dots scattered across continents, bright in some places, dim or empty in others. Behind it is a clustering algorithm and a set of investigator workflows that turn density into signal. Here's how the map is built and what the people working it actually do with it.
How clustering works
We use a supercluster index — the same algorithm Mapbox uses for collapsing markers at low zoom — to keep the map readable at any scale. At each zoom level, sightings within a configurable radius collapse into a single cluster point with a count badge. Zoom in and the cluster breaks apart into its constituent reports. Zoom out and the country-level picture re-emerges.
The radius and the time window are both adjustable. Default is a 24-hour window for the live feed and 30 days for the trend view. Investigators routinely tighten both — a 90-minute window collapses population artifacts and reveals corroboration clusters; a 5-year window surfaces persistent hotspots that survive across seasons.
What density actually means
High density on the map can mean three different things, and they require completely different responses.
First: a real cluster of unrelated events in the same place — interesting if persistent, noise if seasonal. Second: a corroboration cluster — one event seen by many people from different vantage points. This is the most actionable category, and a tight time window is the test that surfaces it. Third: a population artifact — more reports because more people live there. Los Angeles will always have more sightings than Wyoming, not because more is happening over LA but because more humans are looking up.
Investigators rely on a per-capita overlay to separate categories one and three. If a region has high raw counts but low per-capita rates, it's a population artifact. If per-capita rates are elevated, something is genuinely happening there.
Hotspots we're currently watching
The Phoenix–Albuquerque corridor stays active through spring and early summer most years. It's persistent across decades, including the famous 1997 wave. The Hudson Valley shows triangle reports going back to the 1980s — multiple investigator teams have catalogued the regional pattern in print. The Bay Area clusters along the coastal range, especially through the marine-layer months when low ceilings refract distant lights in ways that produce reports.
None of these are conclusions. They're starting points. A hotspot tells you where to send investigator attention, not what's actually causing the reports.
How to use the map yourself
Filter to your home region and the past 30 days. Toggle the heatmap layer. Look for any cluster you weren't already aware of. If you find one, drill into the individual reports — read the witness statements, check the times, look for whether the reports came from a single corroboration event or independent observers across the window.
If your own neighborhood looks empty, don't take that as evidence nothing's happening. It might mean nobody nearby is filing. Be the first. A region with one report becomes a region with twelve once the social proof exists.
The map is a question, not an answer
Every dot on the Sighted map is one observer's best attempt to record something unusual. Density patterns tell you where to focus attention. Time patterns tell you when to focus. Cross-referencing both against aircraft, weather, and astronomical data is how unknowns separate from the explainable. The map isn't the conclusion — it's the place investigators start asking better questions.